The Avondale Market Update

Heather Buckman
Heather’s background in technology, marketing, and social work made real estate the perfect career! When people are buying or selling a house, they ...
Heather’s background in technology, marketing, and social work made real estate the perfect career! When people are buying or selling a house, they ...
The Avondale Market Update
A month by month look at the housing trends in Avondale.
July 2021

June 2021

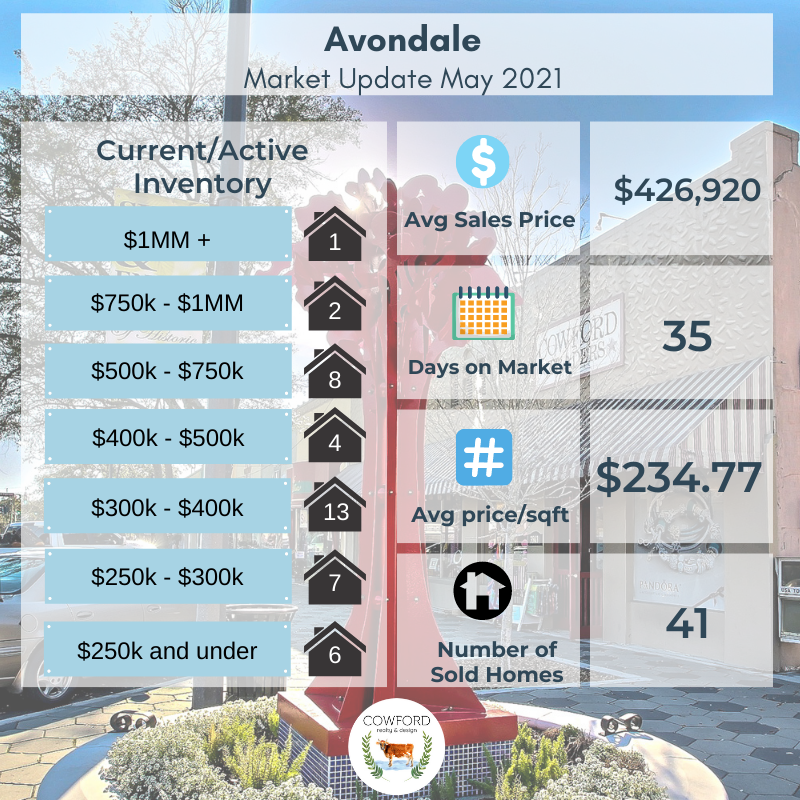
May 2021
April 2021

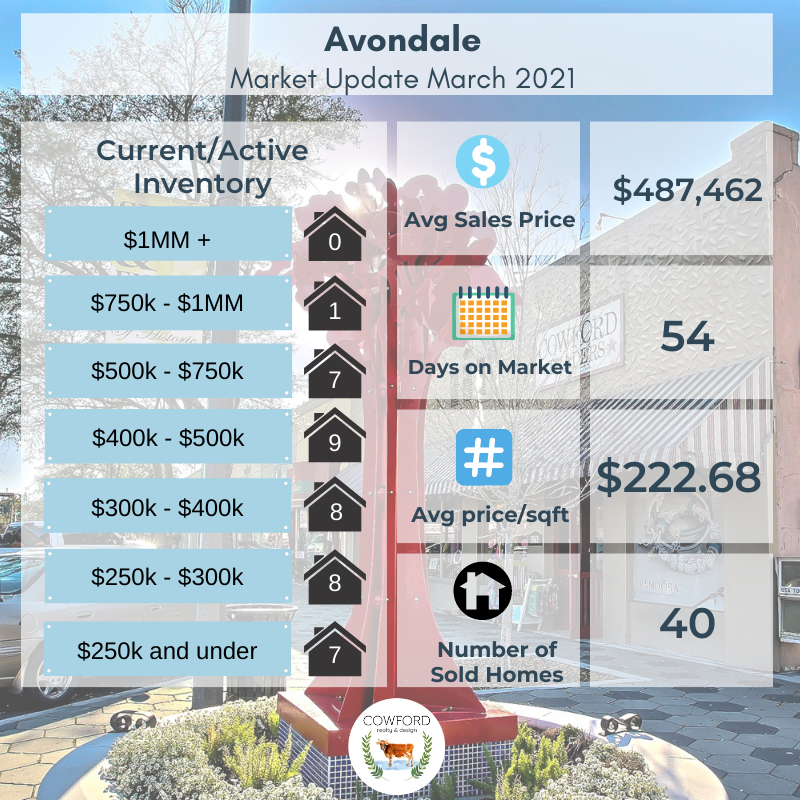
March 2021
February 2021

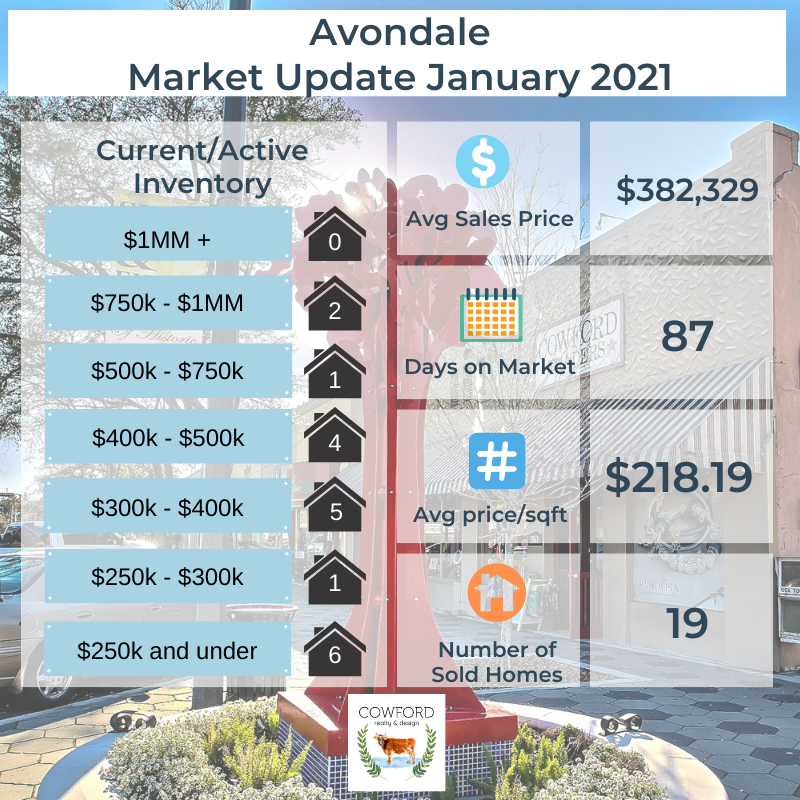
January 2021
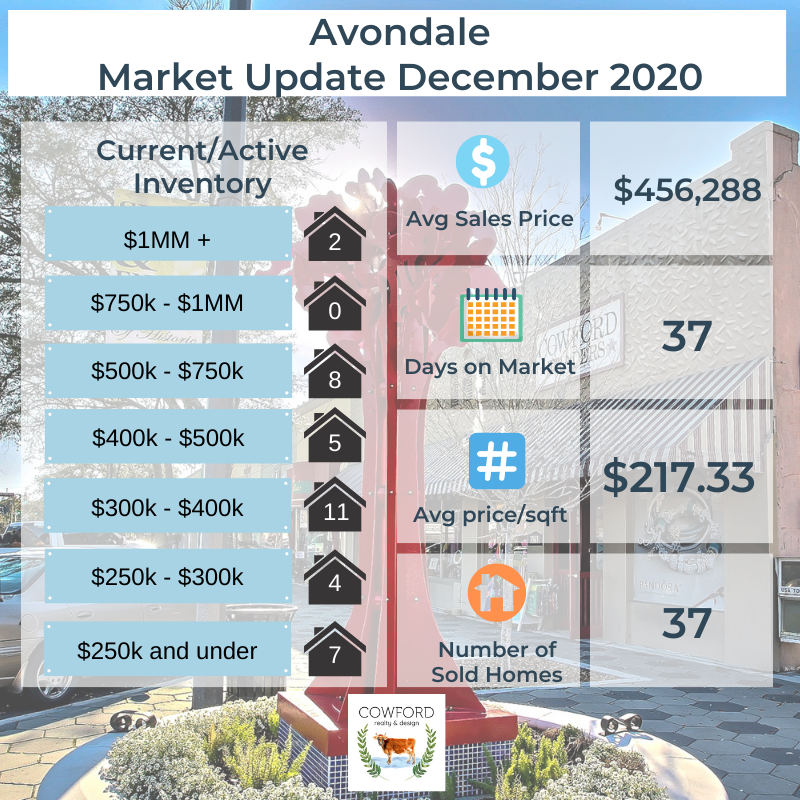
December 2020
November 2020

October 2020

September 2020

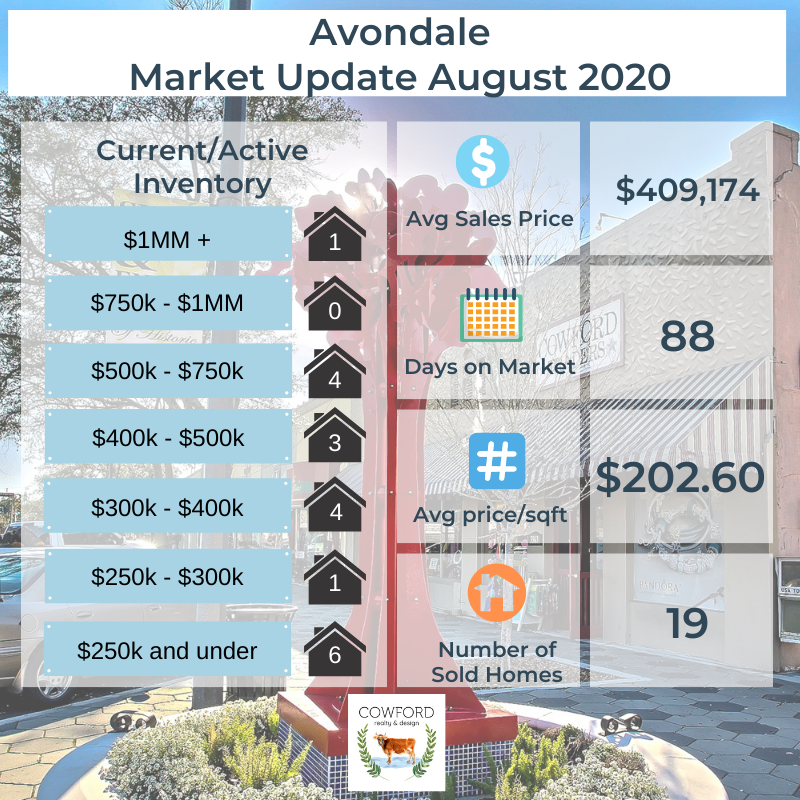
August 2020
July 2020

June 2020

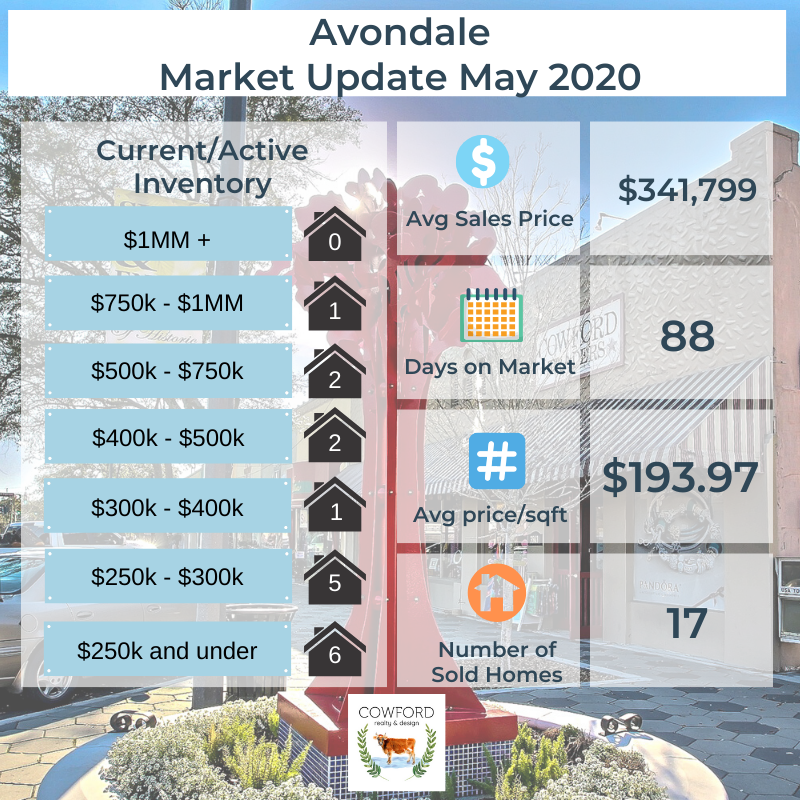
May 2020
April 2020

March 2020

February 2020

January 2020

December 2019

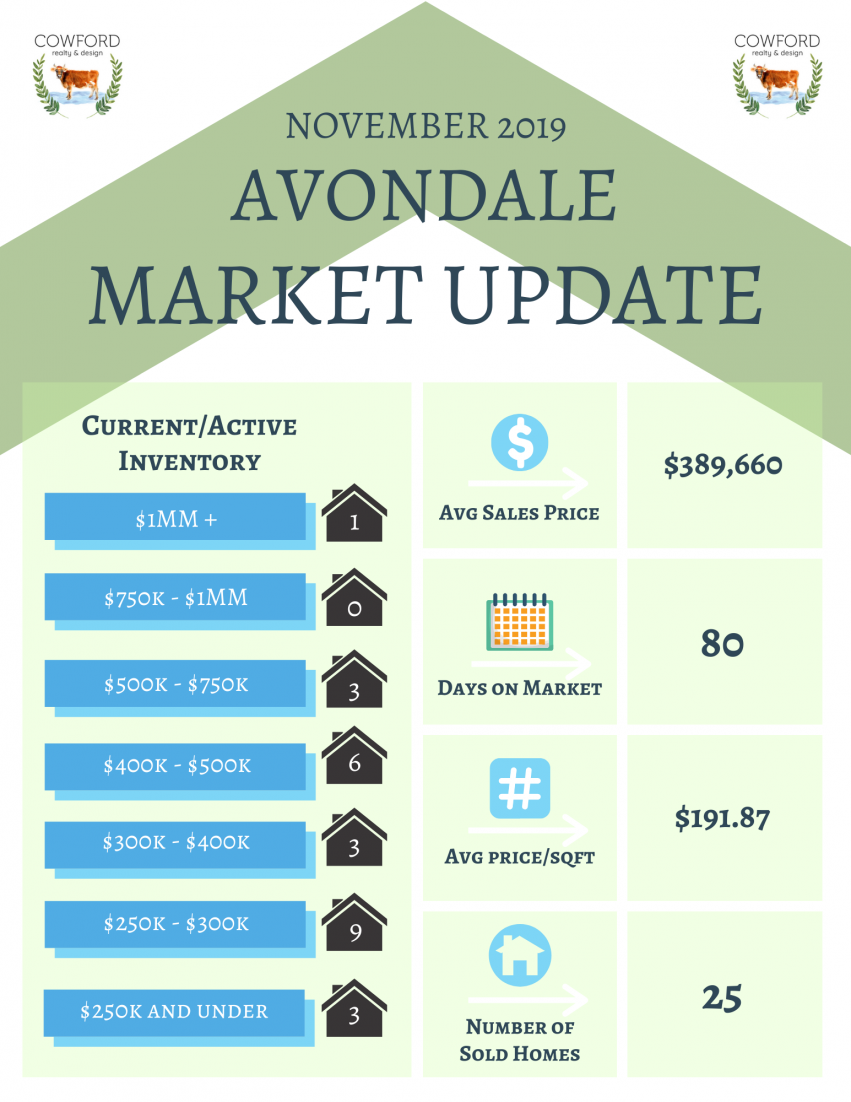
November 2019
October 2019

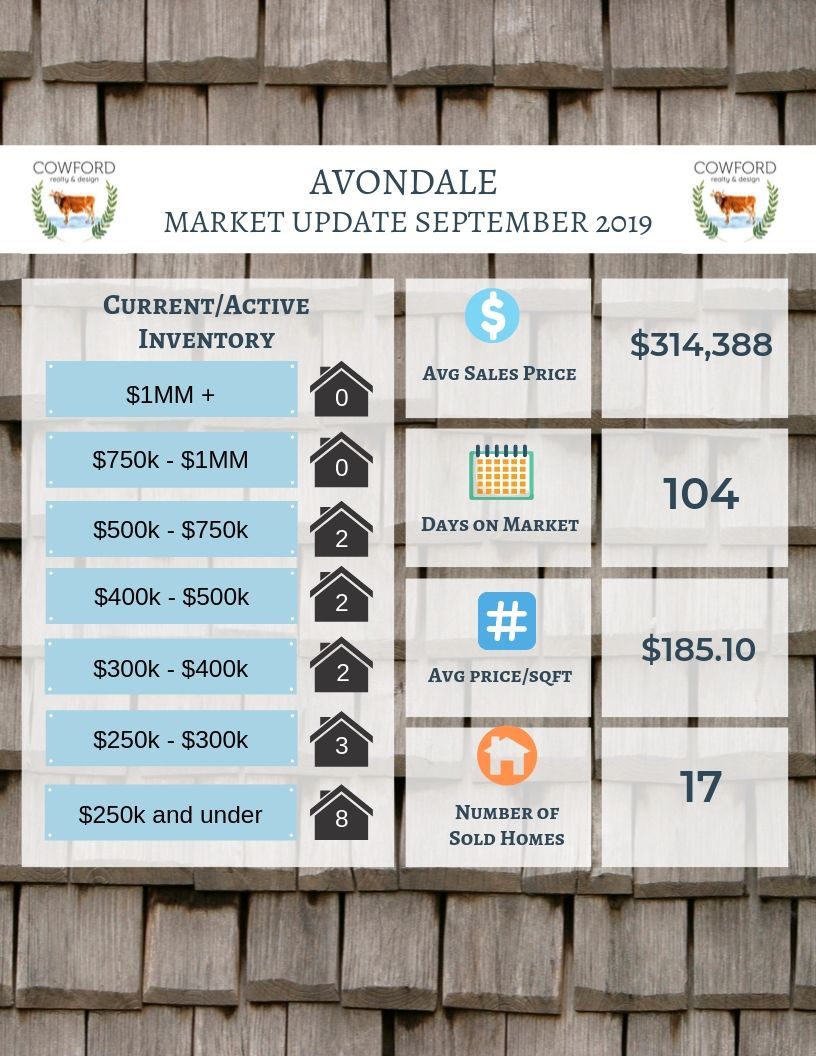
September 2019
As we work our way to the holiday season, Avondale saw a slight cooling, with17 homes sold compared to 20 in August. Although days on market were 104, it is still the case that if a home is priced well, in decent condition and in the "bread and butter" price point, most homes are going under contract very quickly.
August 2019
Lots of activity this month in one of America's most walkable neighborhoods! The average sales price this month is down some from last month to $368k - still a very healthy average. Days on market is almost 3 months, but remember that homes that are priced well and not well over the average price point are going under contract quickly.

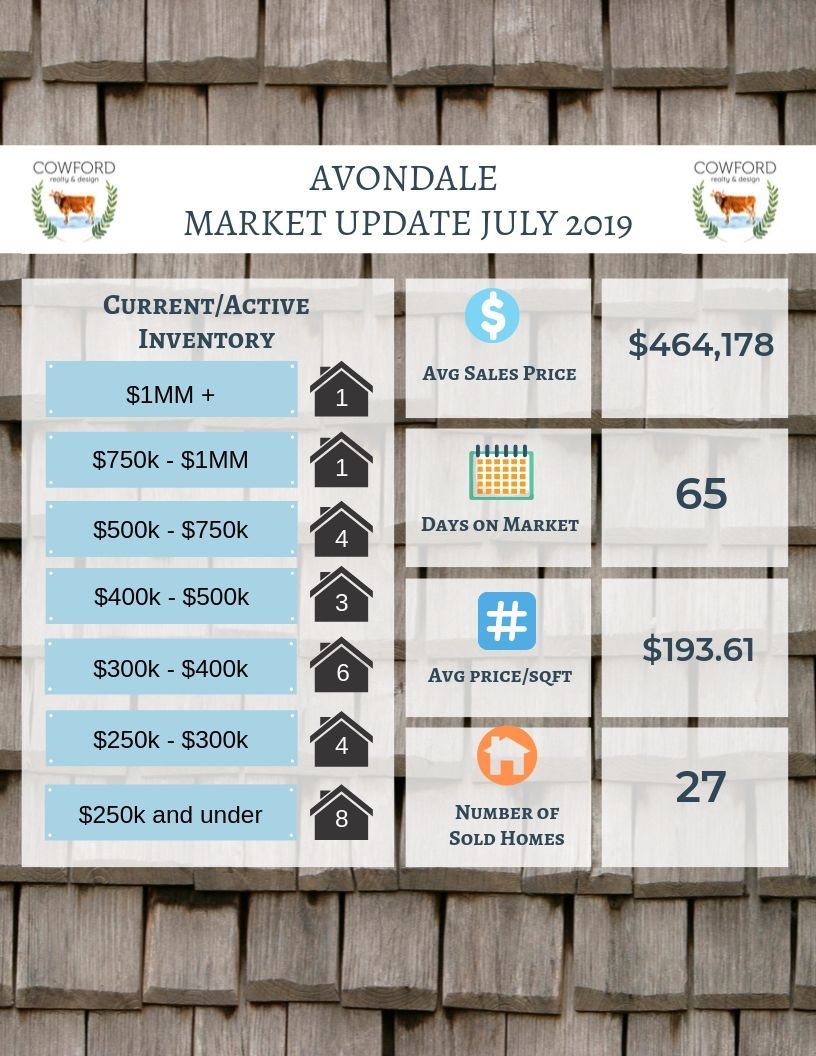
July 2019
No summer slow down here! July was very busy in Avondale, with 27 homes sold.
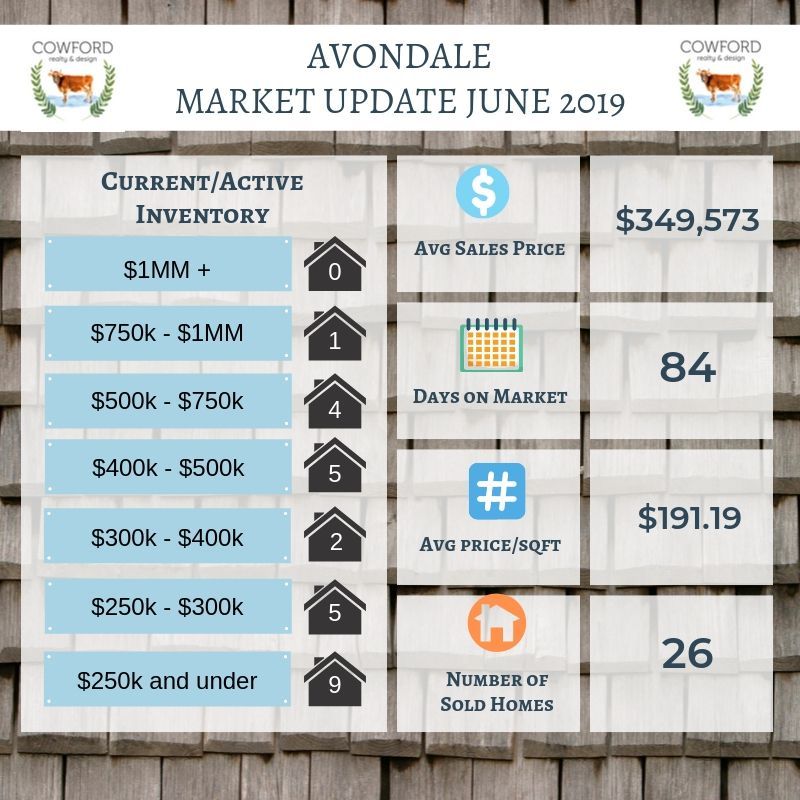
June 2019
With the end of spring here, Avondale experienced a strong June. Inventory is still low, with 4.9 months of inventory in the Riverside/Avondale/Ortega area. Anything less than 6 months makes it a sellers market. Historically low interest rates make this a busy home-buying year.